Skip to content

The Hidden Cost of Low Testing Velocity
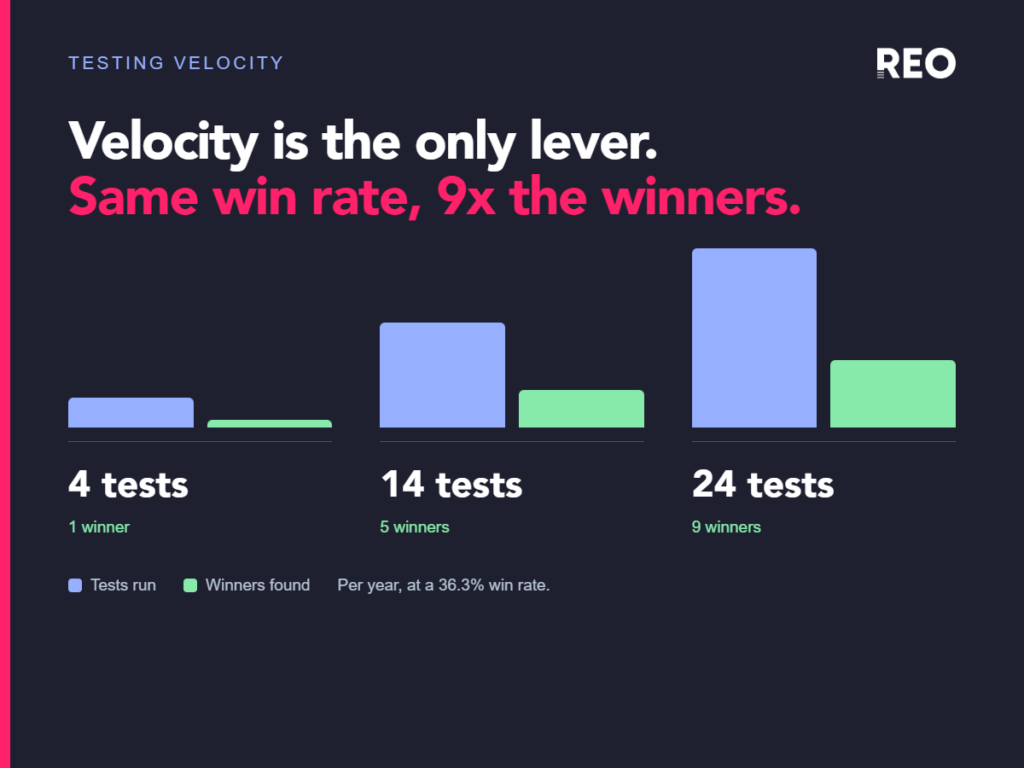
The real cost of low testing velocity The standard pitch for testing velocity goes: run more tests, find more winners, grow revenue faster. It’s true, but it’s also the least interesting reason to care about velocity, and it’s not the argument that actually gets budget approved. If you want the tactical how-to on running the […]