Skip to content

The real cost of low testing velocity
The standard pitch for testing velocity goes: run more tests, find more winners, grow revenue faster. It’s true, but it’s also the least interesting reason to care about velocity, and it’s not the argument that actually gets budget approved. If you want the tactical how-to on running the tests themselves, The Formula for Successful A/B Testing covers that ground.
Actually, the real cost of low velocity isn’t the winners you’re not finding. It’s the compounding effect you’re not building, and the opportunity cost that never shows up on anyone’s dashboard because it was never measured in the first place.
At a 36.3% win rate, 14 tests a year gets you roughly 5 winners. Run 4 tests at that rate and you get maybe 1. Run 24 and you get 9. Over 3 years that gap isn’t linear, it’s the difference between a team with a real evidence base and one still working off last year’s gut calls.
And that 36.3% win rate is the generous version. Optimizely’s benchmark puts the average win rate for revenue-tied tests at just 10%. On the metric leadership actually cares about, most tests lose. You only get enough shots on goal to matter if you’re running enough of them.
Slow programs don’t collapse, they fade. Then someone in a budget meeting asks what CRO shipped this year and the honest answer is “a deck.”
12 tests a year should be the floor. Below that it’s not a program, it’s one person’s opinion getting validated slowly, at cost.
The maths nobody puts in the business case
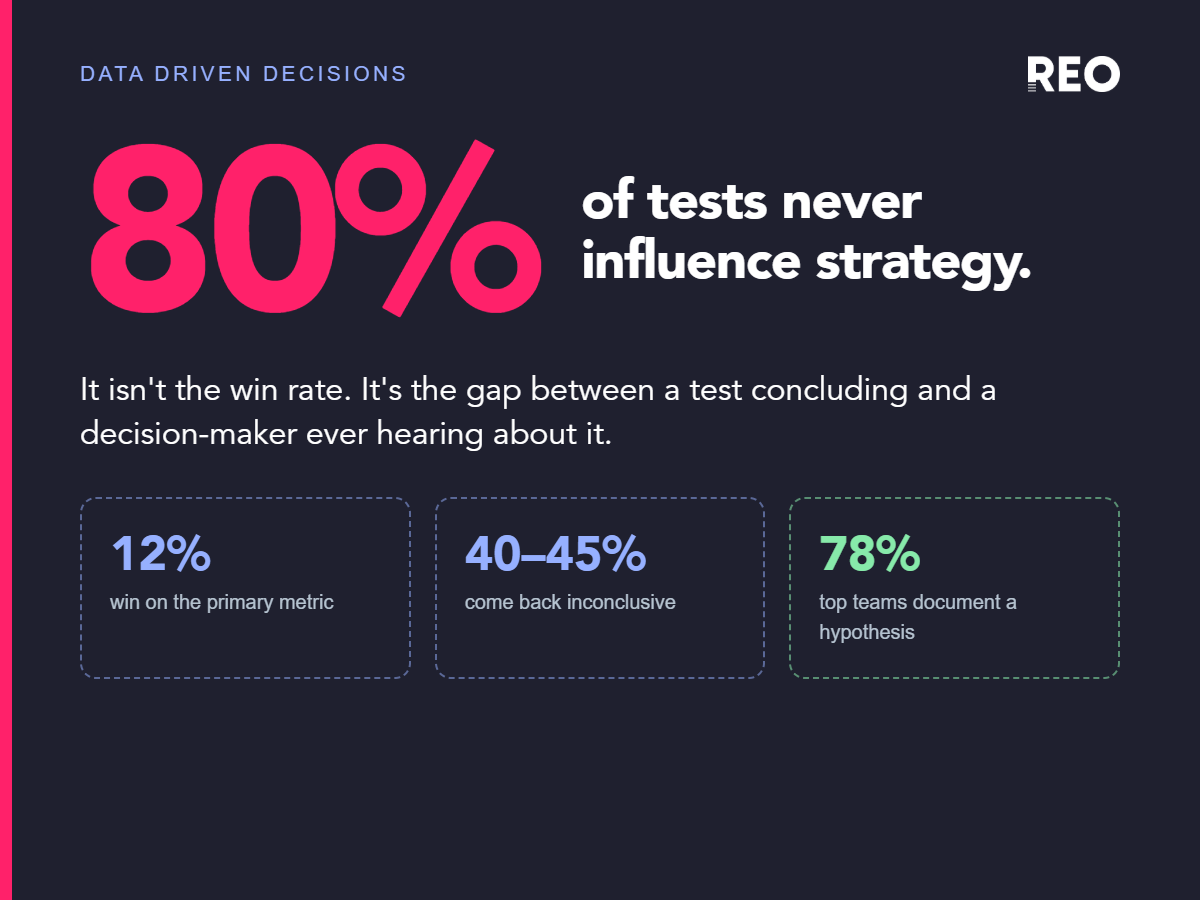
Start with the uncomfortable baseline. Industry win rates sit at roughly 20% across all experiments and closer to 10% for tests tied directly to revenue, per Optimizely’s analysis of 127,000 experiments across 1,100 companies. Ronny Kohavi’s own retrospective, drawn from decades running experimentation at Microsoft, Amazon and Airbnb, found that out of 250 tested ideas, only 20 moved the needle, over 90% of ideas failed to produce a positive result.
That’s not a case against testing. It’s the entire case for velocity. If roughly one in five to one in ten tests wins, the only lever that reliably increases the number of winners you find in a given year is the number of tests you run. A team running 40 tests a year at a 20% win rate finds 8 winners. A team running 10 tests a year at the same win rate finds 2. The skill gap between the teams might be identical. The output gap is 4x, purely from velocity.
That’s the part the standard “test more, win more” pitch misses. Winner magnitude is heavily right-skewed. Most wins are small. A small number of wins are enormous. You can’t select for the enormous ones in advance, you can only increase your odds of catching one by running enough volume that the tail event actually happens inside your test window instead of a competitor’s.
Low velocity has three costs that never make it into a quarterly report, which is exactly why they’re easy to ignore until they compound into something visible.
The costs that don't show up on a P&L
→ Decision debt.
Every product or design decision made without a test is a decision made on opinion. It doesn’t disappear once the roadmap moves on, it sits as unvalidated risk in the product, and it accumulates. Booking.com’s culture explicitly existed to eliminate this: no change shipped, regardless of seniority behind it, without empirical validation. Teams with low testing velocity are quietly accumulating the inverse, a growing stack of shipped decisions nobody has actually verified work.
→ Stalled learning velocity.
A test’s value isn’t only the win or loss, it’s the organisational learning generated either way. A team running one test a quarter generates roughly four learning events a year. A team running three tests a month generates 36. Over three years that’s the difference between an institution that deeply understands its customer’s decision-making and one still guessing at the same open questions it had in year one.
→ Atrophying statistical and operational muscle.
Programmes that test rarely tend to make more implementation errors when they do test, misconfigured sample ratios, under-powered tests, premature calling of results, because the team never builds the operational reps to catch these mistakes early. High-velocity teams develop institutional pattern recognition that low-velocity teams simply don’t get enough repetitions to build.
Why this matters more as programmes mature
This is where we see the most expensive false economy in retail CRO: teams cut testing cadence during “quiet periods,” migrations, resourcing crunches, seasonal peaks, treating velocity as elastic, the same failure mode covered in why experimentation programmes lose momentum. It compounds the way any interrupted compounding process does. Ramping back up from zero doesn’t just cost you the tests you missed, it costs you the learnings, the operational sharpness, and the tail-event winners those tests would have surfaced.
The question worth sitting with
If you tracked the actual cost of your programme’s slowest quarter this year, not the tests you ran, but the tests you didn’t, what would that number look like next to the dev hours it would have taken to keep even a minimal cadence going?
See how your programme compares with the Maturity Model Assessment.
FAQ
How many A/B tests should a CRO programme run per year?
12 tests a year should be treated as the floor. Below that, it isn’t really a testing programme, it’s one person’s opinion being validated slowly, at cost.
Why do most A/B tests fail to win?
Optimizely’s analysis of 127,000 experiments puts average win rates at around 20% across all tests, and closer to 10% for tests tied directly to revenue. Losing is the statistical norm, not a sign a programme is failing.
What is "decision debt" in conversion rate optimisation?
Decision debt is the risk that builds up when product or design changes ship without being tested. It doesn’t disappear once the roadmap moves on, it sits as unvalidated risk that compounds over time.
Does pausing testing during quiet periods actually save resource?
No. Cutting testing cadence during migrations, resourcing crunches or seasonal peaks doesn’t just lose the tests you skipped, it costs the learnings, the operational sharpness, and any tail-event wins those tests might have surfaced.
How many experiments do companies like Amazon and Google run?
Amazon runs over 12,000 experiments a year, and Booking.com and Google run comparable volumes, according to Kohavi and Thomke’s Harvard Business Review research on controlled experimentation at scale.
Can a single A/B test really generate millions in revenue?
Yes. Bing’s ad display test generated $100 million in additional annual US revenue, and Google’s “41 shades of blue” test produced a documented $200 million increase. These outlier wins only surface when testing volume is high enough to catch them and when the test hypotheses are evidence backed.
Sources
- Optimizely, “Top 10 takeaways from running 127,000 experiments” (2026) – optimizely.com
- AB Tasty, “1,000 Experiments Club: A Conversation With Ronny Kohavi” (2026)
- Kohavi, R. and Thomke, S., “The Surprising Power of Online Experiments,” Harvard Business Review (2017)