Skip to content

What an Accessibility Conformance Score Cannot Tell You About Customer Experience
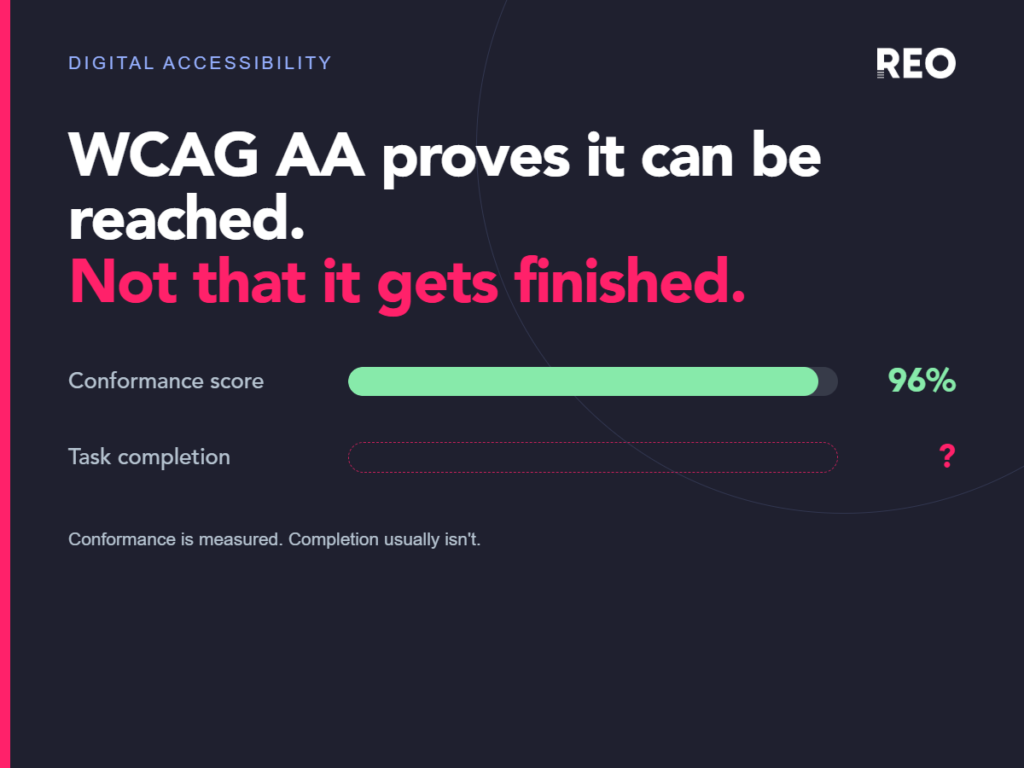
What an Accessibility Conformance Score Cannot Tell You About Customer Experience Most accessibility investment follows one path. An organisation commissions an audit, works through the findings, ships the fixes, and reaches the middle conformance level (AA) of the Web Content Accessibility Guidelines (WCAG). Months of work sit behind that. Real money too. At the end […]
Why 80% of Tests Never Lead to Data Driven Decisions
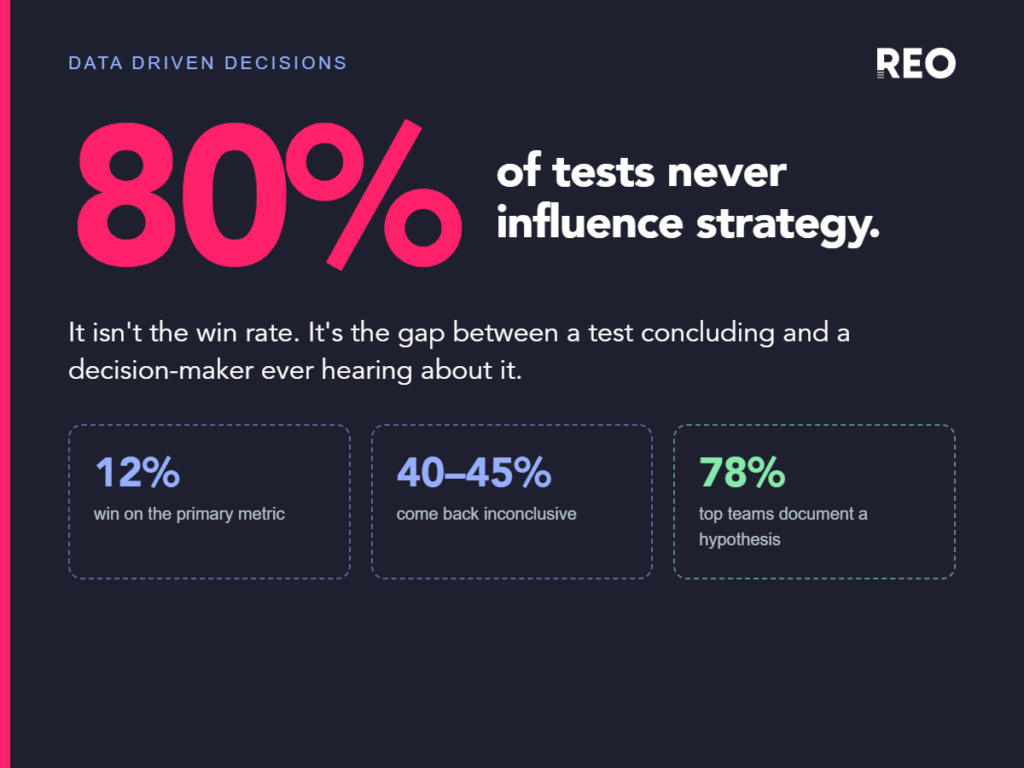
Why 80% of Tests Never Influence Strategy The common explanation for why most A/B tests don’t shape strategy is that most A/B tests lose. Simple story: you run a test, it doesn’t win, so obviously it doesn’t influence anything downstream. Nothing to see here. Actually, that explanation doesn’t hold up against the numbers, and it […]
How Leading Retailers Choose a Prioritisation Framework
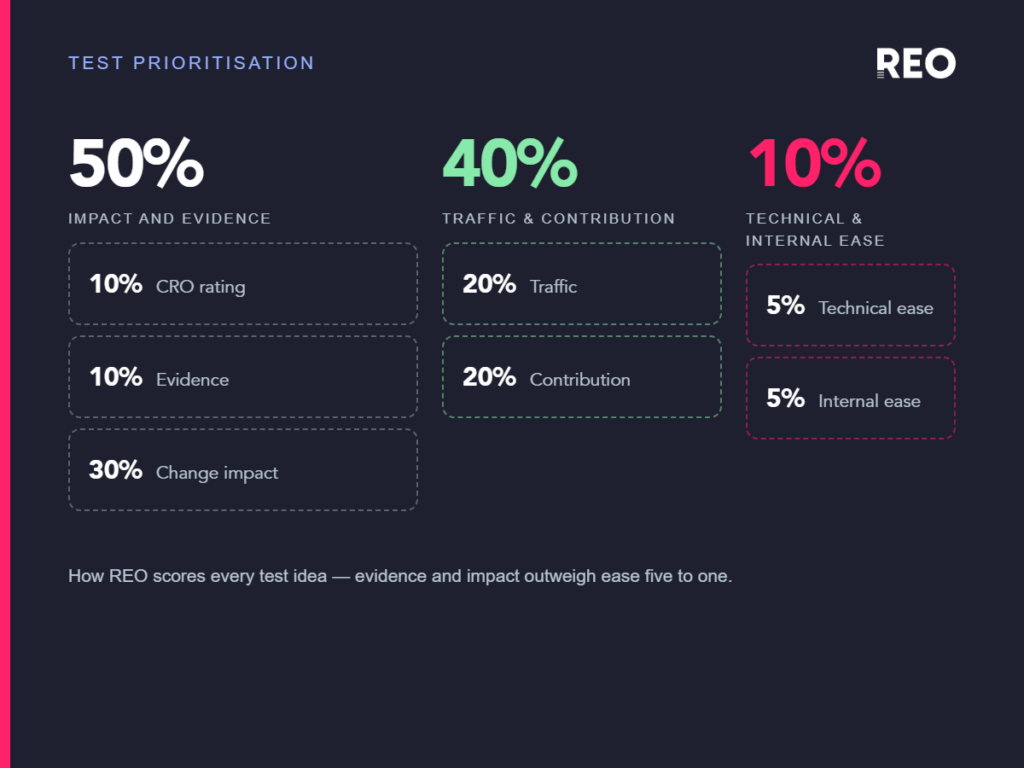
How leading retailers decide what to test Ask most CRO teams how they choose what to test next, and you’ll hear some version of “we look at the analytics and pick what seems broken.” It sounds reasonable. It’s also how most testing programmes end up with a backlog full of button-colour experiments and homepage banner […]
The Hidden Cost of Low Testing Velocity
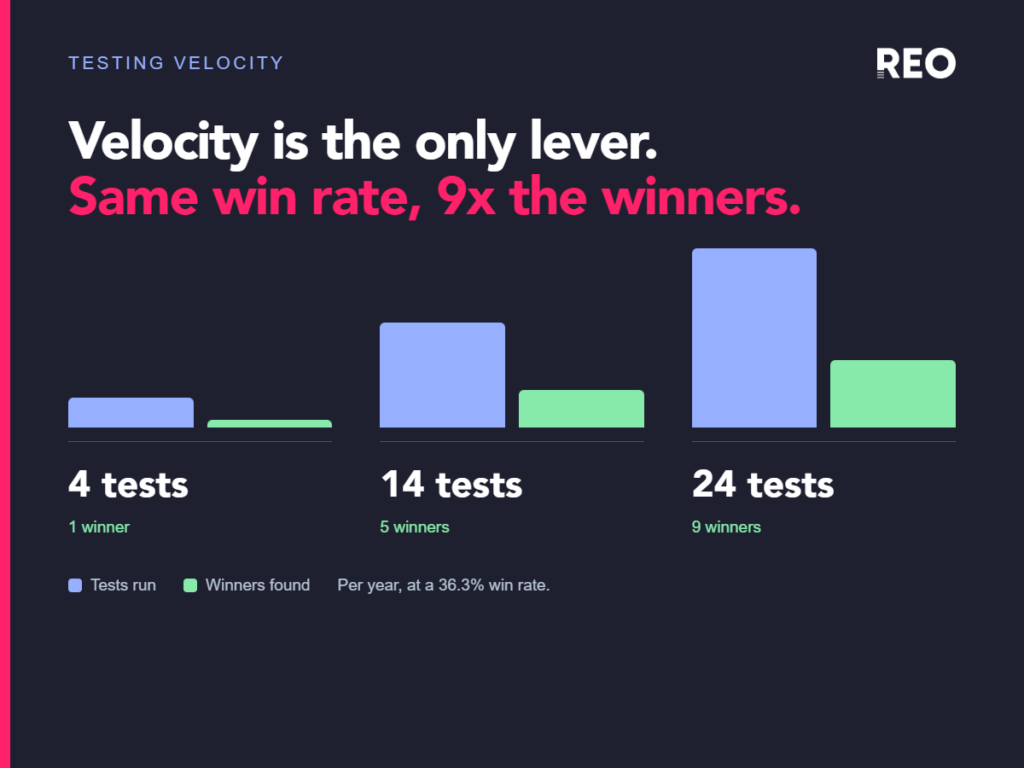
The real cost of low testing velocity The standard pitch for testing velocity goes: run more tests, find more winners, grow revenue faster. It’s true, but it’s also the least interesting reason to care about velocity, and it’s not the argument that actually gets budget approved. If you want the tactical how-to on running the […]
Why experimentation programmes lose momentum
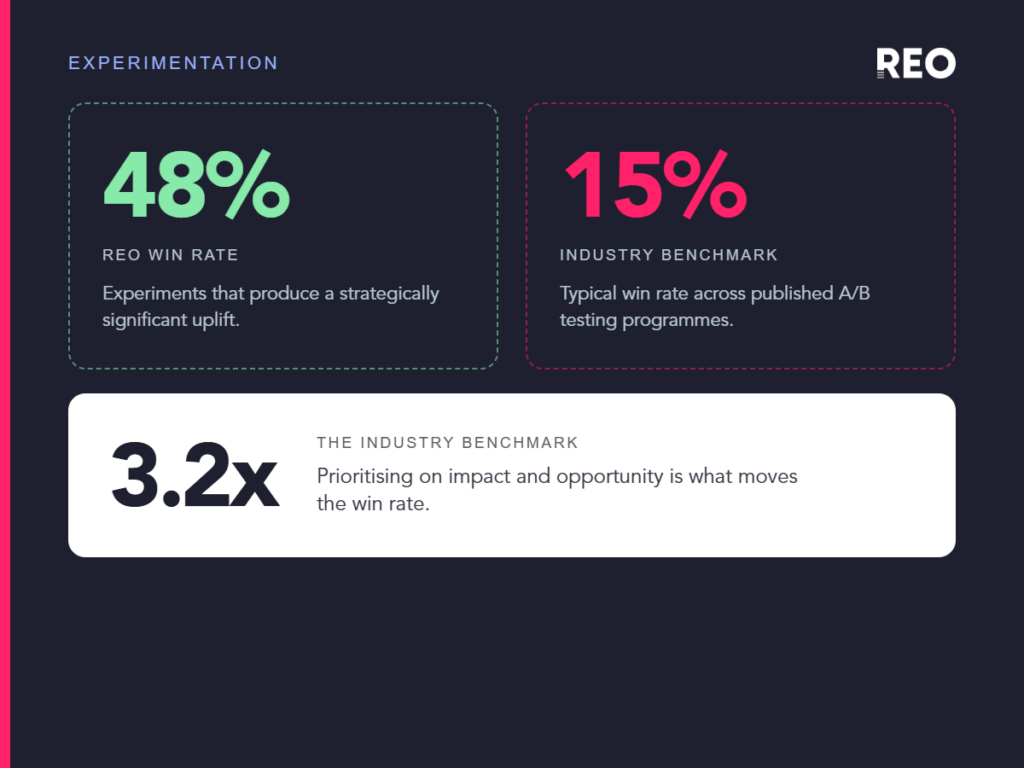
Why your CRO programme stalls (and how to fix it). Most teams assume their CRO programme dies from a lack of ideas. You run out of hypotheses, the backlog goes quiet, testing slows down. Fix the ideation problem and the programme comes back to life. Actually, that’s rarely what kills a programme. In over a […]